U.S. family-dentistry utilisation still reflects a large COVID-era shock followed by an uneven recovery.
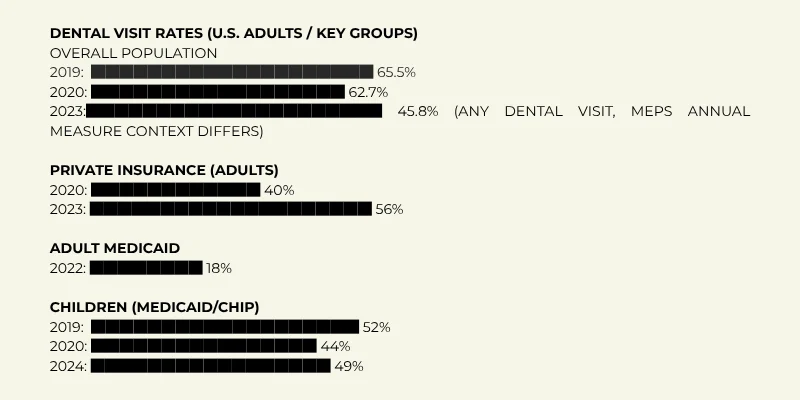
On a broad all-person measure, 153.1 million Americans had at least one dental visit in 2023, equal to 45.8% of the population in MEPS. For working-age adults, NHIS showed a fall from 65.5% having a dental visit in 2019 to 62.7% in 2020.
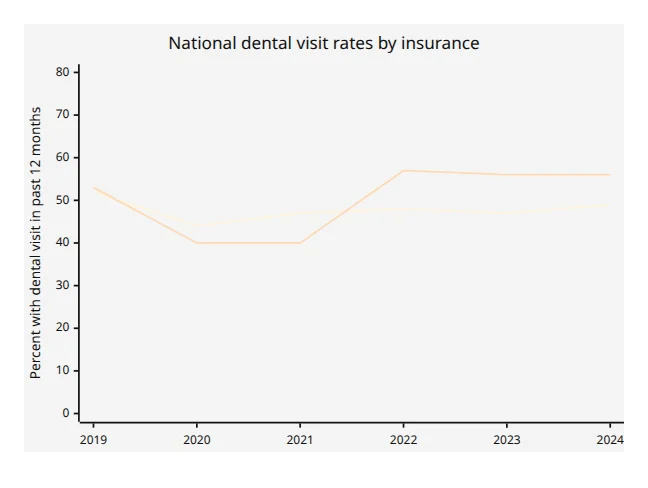
Recovery has been strongest among privately insured adults, whose 12‑month dental-use rate rose from 40% in 2020 to 56% in 2023, while adult Medicaid remained much lower at 18% in 2022.
Children recovered only partially: child Medicaid/CHIP use fell from 52% in 2019 to 44% in 2020 and was 49% in 2024, still below pre-pandemic levels.
The strongest national gradients remain socioeconomic.
Among adults ages 18–64, 2020 dental-use rates ranged from 45.7% below poverty to 76.0% above 400% of the federal poverty level; women used care more than men; and non-Hispanic White and Asian adults used care more than Hispanic and non-Hispanic Black adults. Among adults 65+, 2022 use ranged from 35.3% below poverty to 80.5% above 400% of poverty, and was lower among people with no dental cover, diabetes, heart disease, or fair/poor health.
These patterns matter for “family dentistry” because they shape both preventive demand and delayed restorative demand.
For Evansville, the best local proxy is Vanderburgh County, because the local 2024 Community Health Needs Assessment explicitly defines the county as the service area owing to data availability.
Vanderburgh’s dentist supply is not obviously weak on paper: 1,360 residents per dentist versus 1,680 statewide and 1,370 nationally. Yet local access appears materially worse than that supply figure suggests.
In the 2024 CHNA, dental care ranked as a priority issue; 78.6% of stakeholders thought it was worsening and 85.7% thought resources were inadequate.
The most common dental barriers were no health/dental insurance or underinsurance (28%), lack of providers/services (23%), provider waitlists or appointment times (15%), poverty (13%), and transport (8%).
The likeliest explanation for Evansville’s divergence is not simple provider count, but payer and population mix. Vanderburgh has higher public coverage than Indiana overall, with Medicaid/means-tested public cover at 22.3% and Medicare at 20.1%; 7.3% of county residents under 65 are uninsured, while Evansville city itself is at 9.8%.
The county is older than Indiana, and local surveys report high burdens of obesity, hypertension, smoking, diabetes, and heart disease, all of which raise oral-disease risk and complicate regular preventive attendance.
Indiana policy also matters: HIP Plus includes dental, HIP Basic does not, and some fee-for-service/emergency categories remain tightly limited.
On a scenario basis, the most plausible 2030 outlook is modest national utilisation growth, but with persistent inequality.
The U.S. baseline case is a slow rise in overall annual dental visiting from the 2023 MEPS level, driven by ageing, continued adult Medicaid benefit expansion, and private-market recovery.
Evansville should also see rising demand, but realised utilisation is likely to lag unless payer friction, transport barriers, and appointment availability improve.
A downside scenario would keep adult Medicaid use near present levels and shift more demand into restorative and urgent care; an upside scenario requires preservation of adult Medicaid dental benefits, better reimbursement and workforce retention, and operational use of tele-dentistry for screening and triage.
This forecast is an inference from the observed post-pandemic trajectory, benefit design, and local barrier profile rather than a direct county claims model.
Scope and methods
This report prioritises primary and official sources: CDC/NCHS NHIS and oral-health surveillance,
MEPS/AHRQ, CMS Medicaid policy material, Indiana Medicaid/FSSA documents, U.S. Census QuickFacts, and the Vanderburgh County CHNA.
Two caveats are important. First, key national measures are not interchangeable: NHIS tracks visit history, MEPS counts persons with any dental event, and ADA HPI’s recent insurance-specific series is claims-based.
Second, no standard public, countywide dental-claims series was identified for Evansville itself, so the local section uses Vanderburgh County and the Greater Evansville Health Survey as the closest official/public proxies.

National picture
The national recovery is best understood as a three-speed market.
Privately insured adults recovered most strongly, surpassing pre-pandemic dental-use levels by 2023; child Medicaid/CHIP recovered only partially; and adult Medicaid remained flat at a low level.
At the same time, national unmet need stayed large: in MEPS 2023, 36.5 million people reported that they could not afford dental care in the prior year.
ADA HPI’s insurance-specific charts show that in 2023 cost barriers remained far higher for publicly insured and uninsured adults than for privately insured adults.
The demographic pattern is consistent across datasets: women use dental services more than men (services include root canal treatment, dental implants,and professional teeth whitening); income is the strongest gradient; and racial/ethnic differences map closely onto income, coverage, and historical access gaps. Older adults show an additional health-status gradient: having dental cover, better general health,
National preventive versus restorative splitting is less cleanly published in official annual series than overall visit rates, but the available U.S. claims evidence points in one direction: preventive and diagnostic services recovered faster after COVID than restorative procedures, implying that delayed disease management remained in the system even as recall visits returned.
That interpretation is consistent with CDC oral-health surveillance, which still shows substantial disease burden: 46.0% of children ages 2–19 had untreated or restored caries in 2017–March 2020, and 13.2% of adults 65+ had complete tooth loss. CDC’s 2024 surveillance report also explicitly stratifies caries, tooth retention, and edentulism by age, sex, race/ethnicity, poverty, education, and smoking, underscoring that restorative demand is socially patterned.
Access and policy are moving in opposite directions. On the positive side, adult Medicaid dental benefits broadened: by 2025, 38 states and DC offered enhanced adult benefits, and 18 states had expanded since 2021.
On the negative side, dentist participation in Medicaid/CHIP was only 41% in 2024 and had been broadly stable for a decade, while Medicaid fee-for-service reimbursement generally lagged both dentist charges and private reimbursement.
In practical terms, coverage expansion has improved demand-side entitlement faster than supply-side participation.
Evansville and Indiana comparison
For Evansville, the balance of evidence points to higher underlying need and more constrained realised access than a simple dentist-to-population ratio would suggest.
Vanderburgh County’s formal supply is close to the national figure, but the local CHNA records a much harsher lived-access picture: insurance gaps, provider scarcity, waitlists, and transport all feature prominently.
Dental care was also one of the issues stakeholders most often judged to be worsening and under-resourced.
| Measure | U.S. | Indiana | Evansville proxy |
| Residents per dentist | 1,370:1 | 1,680:1 | 1,360:1 in Vanderburgh |
| Uninsured under 65 | 9.6% | 7.6% in Vanderburgh comparison table uses state 7.6 for county benchmark; U.S. QuickFacts 9.6% | 7.3% in Vanderburgh; 9.8% in Evansville city |
| Medicaid / means-tested public cover | 20.7% | 19.6% | 22.3% |
| Medicare cover | 18.1% | 18.0% | 20.1% |
| Age 65+ share | — | 16.4% | 17.8% |
| Adult smoking | 17% | 17% | 17% by CHR; 10% in local survey |
| Adult obesity | — | 38% | 39% |
| Diabetes prevalence | 10% | 11% | 11% by CHR; 8% in local survey |
Table note: The “Evansville proxy” is Vanderburgh County unless the city value is explicitly stated. Insurance percentages are coverage mix, not mutually exclusive dental claim payment shares.
Sources: Vanderburgh CHNA tables and summary text; Evansville and Vanderburgh QuickFacts.
These differences help explain why Evansville can have a respectable dentist ratio yet worse effective access.
The county is slightly older than the state, has more public coverage, and reports heavier chronic-disease and smoking burdens, all of which increase oral-disease risk. Local stakeholder evidence then shows the conversion problem from nominal supply to practical access: 28% of dental barriers referenced underinsurance or no insurance, 23% provider shortage, 15% appointment waits, and 8% transport.
| Policy area | U.S. baseline | Indiana position | Likely implication for Evansville |
| Adult Medicaid dental | Optional for states; 38 states + DC enhanced in 2025 | Not uniform: HIP Plus includes dental; HIP Basic excludes dental; some Package E/B populations are emergency-only | Coverage churn and plan status can interrupt preventive attendance |
| Adult Medicaid benefit intensity | Higher adult use in enhanced states: 21% vs 15% limited vs 8% emergency-only in 2022 | FFS adult services are covered but subject to limits; emergency-only packages exclude routine prevention | More sensitivity to plan design than in states with universal comprehensive adult benefits |
| Telehealth / teledentistry | CMS allows broad Medicaid telehealth flexibility for covered services | Indiana telehealth law is broad; IHCP reimburses telehealth for enrolled providers under programme rules | Useful for triage, recall support, and specialist advice, but not a substitute for operative dentistry |
Table note: The telehealth row reflects policy capacity rather than measured county dental-utilisation gains.
Forecasts to 2030
Because no public Evansville dental-claims series was identified, the forecast is scenario-based.
The baseline assumes: no major retrenchment in adult Medicaid dental benefits, stable dentist participation, moderate wage and inflation pressure, gradual post-pandemic normalisation of recall care, and continued high chronic-disease prevalence.
The downside assumes Medicaid fiscal pressure, reimbursement erosion, and persistent workforce/transport bottlenecks.
The upside assumes benefit preservation, better provider participation, targeted transport/navigation support, and operational use of tele-dentistry for screening and triage.
These are inferences from the observed policy and utilisation data, not published official projections.
| Scenario | U.S. by 2030 | Evansville by 2030 |
| Baseline | Overall annual dental visiting edges above the 2023 MEPS level; adult Medicaid rises modestly from ~18% to the low 20s; child Medicaid/CHIP returns to roughly pre-pandemic levels | Demand rises faster than realised use; unmet need stays above the national average in low-income adults unless appointment availability improves |
| Downside | Overall visiting stalls; adult Medicaid remains in the mid- to high-teens; preventive delays increase later restorative burden | Waitlist and underinsurance pressures intensify; more episodic and extraction-oriented care among vulnerable adults |
| Upside | Coverage and participation gains lift overall visiting more clearly; the private/Medicaid gap narrows somewhat, though not fully | The local gap versus national utilisation narrows if HIP Plus retention, provider participation, patient navigation, and transport improve together |
The most credible baseline judgment is therefore modest U.S. growth and slower Evansville growth.
Evansville’s structural risks are not unique, but they are concentrated: higher public coverage, an older age profile, documented transport and waitlist barriers, and a burden of cardiovascular and metabolic comorbidity that is likely to translate into higher restorative and periodontal demand over time.
Key sources and limitations
Key sources used here were CDC/NCHS NHIS adult dental-utilisation briefs; CDC’s 2024 oral-health surveillance update and FastStats; MEPS 2023 person-level dental-use and affordability codebook outputs; ADA Health Policy Institute’s 2024 dental-use/coverage/barrier summary and 2025 Medicaid programmes report; Indiana Medicaid’s 2026 Dental Services module and HIP FAQ; U.S. Census QuickFacts; and the Vanderburgh County 2024 CHNA.
The main limitation is local granularity. I did not identify a public, countywide series for annual dental visit rates, preventive/restorative splits, or average dental wait days for Evansville itself. For that reason, the Evansville section necessarily relies on Vanderburgh County provider, insurance, and barrier measures plus local survey evidence, rather than direct dental-claims utilisation.
That is strong enough for comparative direction and scenario planning, but not for a precise city-level utilisation point estimate.
References
MEPS HC 251 2023 FULL YEAR CONSOLIDATED DATA CODEBOOK
Dental Care Utilization Among Adults Aged 18−64: United States, 2019 and 2020
2024 COMMUNITY HEALTH NEEDS ASSESSMENT (June 2025)