Dental implants have rapidly become a mainstream solution for tooth replacement in the United States over the past decade.
This guide provides a comprehensive overview of recent trends in dental implant adoption nationally and within Indiana, drawing on the latest data (primarily 2019–2024).
We examine the number of Americans receiving implants each year, the rate of growth, and the demographic factors influencing implant uptake. Indiana-specific statistics are highlighted, including state- and county-level data where available, to illuminate how this Midwestern state compares with national patterns.
The goal is to inform dental professionals, students, and public health planners about the current dental implant trends in the United States use and its implications for oral health strategy.
National Trends in Dental Implant Adoption
Prevalence and Growth: Dental implant use in the U.S. has risen dramatically in recent years. Around 2015, only about 5–6% of U.S. adults who were missing at least one tooth had ever received a dental implant, up from under 1% in 2000. This represents a nearly eight-fold increase in implant prevalence over 15 years.
Since then, adoption has continued to accelerate. By 2019, more than 3 million dental implants were placed in the U.S. (prior to the pandemic). This corresponds to roughly 1 million Americans receiving new implants each year, many getting more than one implant (about 2.5 implants placed per patient on average).
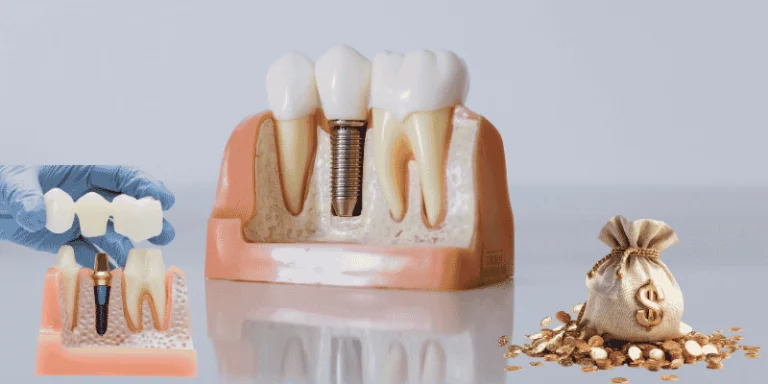
Even accounting for a brief slowdown in 2020 due to COVID-19, the overall trend is one of robust growth. Industry data show the U.S. dental implant market was valued around $2.1 billion in 2024, with projections of nearly $3.1 billion by 2031, an annual growth rate around 6%.
Implants are now considered a standard of care for eligible tooth loss patients, reflecting both increased provider expertise and patient demand.
Population Uptake: Despite the surge in procedures, implants still reach only a fraction of those who could benefit. Over 120 million Americans have at least one missing tooth (and around 36 million have none of their natural teeth), yet only on the order of a few million have ever received implants.
In other words, perhaps 2–3% of Americans with tooth loss have replaced teeth with implants, illustrating a large gap in treatment uptake.
High costs and limited insurance coverage are key barriers that leave many toothless individuals without implants. Nonetheless, the uptake is expanding steadily each year as implants become more widely available.
Mainstream awareness has grown and technology improvements (such as advanced imaging and guided surgery) have made implant procedures more predictable.
Surveys indicate that by the early 2020s, an estimated 3 million or more implants are being placed annually in the U.S., a number expected to keep rising with the aging population.
Health researchers project that if recent trends continue, the prevalence of implant use among U.S. adults with missing teeth could reach roughly 17% by 2026, and in optimistic scenarios potentially as high as 20–23%.
Even the conservative forecasts show continued growth, underscoring that dental implants are firmly on track to become a far more common feature of dental care in the next decade.
If you’re missing teeth, schedule a consultation at our clinic in Evansville, IN, to discuss implant options based on your oral health, lifestyle, and long-term goals.
Annual Placement Rates: From a practice standpoint, the annual placement rate of implants has climbed to unprecedented levels.
The oft-cited statistic in the implant community is that about 500,000 new patients were getting implants each year in the early 2010s; now that figure appears to be closer to 800,000–1,000,000 new implant patients per year in the U.S., as of 2019–2022.
Because many patients receive multiple implants, the total number of individual implant fixtures placed is higher, roughly 2.5 to 3 million implants placed per year nationwide. This reflects how routine implant dentistry has become in many dental practices.
The American Academy of Implant Dentistry notes that implants are increasingly the preferred treatment for replacing missing teeth as opposed to dentures or bridges, given their longevity and functional advantages.
In fact, more than 150 million Americans are missing at least one tooth, but only about 1 million are treated with implants each year, highlighting the immense room for growth.
Market analysts anticipate “explosive growth” in implant demand through the 2020s, fueled by an aging population, greater public awareness, and improved techniques that make implant therapy more accessible and successful.
The U.S. implant market’s compound growth in the high single digits annually is expected to continue, keeping pace with global trends (for context, the global dental implant market is projected to exceed $13 billion by the mid-2020s).
Success Rates and Technology Drivers: Importantly, the high success rate of dental implants (95–98%) has reinforced confidence among both providers and patients.
Ongoing innovations, from cone-beam CT scans for precise planning to the advent of digital design and even antibacterial implant coatings, have improved outcomes and reduced complications.
These advances, combined with implants’ ability to preserve jaw bone and restore near-natural chewing function, have solidified implants as a premier option.
The demographic shift of Baby Boomers into older age (by 2030, Americans 65+ will outnumber those under 18) also means a larger segment of the population is experiencing tooth loss and seeking durable solutions. All these factors contribute to the steady rise in implants as a common dental procedure across the country.
Demographic Patterns in U.S. Implant Adoption
Dental implant adoption in the U.S. varies significantly across different demographic groups. Age is a primary factor: older adults receive the majority of implants, since tooth loss accumulates with age.
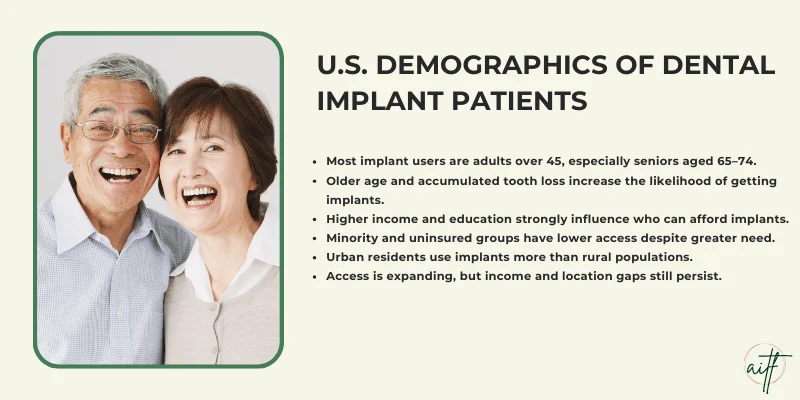
National survey data show that among adults with implants, over 70% are age 45 or olde, with the peak proportion in late-middle age.
People aged 65–74 have seen the largest increase in implant prevalence since 2000, climbing by about 13 percentage points (from near 0% to over 12% of those with missing teeth in that age group). In fact, a 65-74 year-old was about twice as likely to have an implant as a 45-54 year-old in the mid-2010s.
This makes sense given that seniors have had more years of accumulated dental issues, by their late 60s, many have lost multiple teeth and are ideal candidates for implants if financially able.
Younger adults (<35) rarely have implants except in cases of trauma or congenital missing teeth; in 2015 only ~0.5–1% of 18-34 year-olds with a missing tooth had gotten an implant, versus over 5% of 55-64 year-olds and even higher for 65+.
The rapid rise in implants among older Americans is a positive trend for quality of life, as it means more seniors are retaining function (or avoiding dentures) through implant restorations.
Socioeconomic Disparities: Dental implants remain an expensive elective procedure, and adoption skews toward those with higher socioeconomic status.
Nationally, adults with more than a high school education account for about 76% of implant recipients, far outpacing those with only high school or less.
Education often correlates with income and insurance, which are critical in affording implants. Likewise, about 80% of individuals with implants are White, with racial minorities (who on average have lower access to dental care) making up only ~20% of implant patients.
This is disproportionate to need, for example, Black and Hispanic Americans have higher rates of tooth loss on average, yet are underrepresented among those receiving implants.
Insurance coverage plays a role: while most private dental insurance plans do not fully cover implants, having any insurance or the means to pay out-of-pocket increases likelihood of getting an implant. Adults with no dental insurance rarely obtain implants.
The data show implant prevalence was several times higher among insured individuals compared to the uninsured. Public insurance (e.g., Medicare or Medicaid) generally does not cover implant surgery, which greatly limits access for low-income and elderly patients who rely on those programs.
Cost remains the major barrier cited for the vast majority of people who might want implants but do not pursue them. In sum, implants are far more common among affluent, well-educated patients, a clear inequity in oral health care.
As of 2016, an American with a college education was nearly twice as likely to have an implant as someone with a high school education or less. Bridging this gap will require policy changes (such as expanded insurance coverage or public dental programs) to make implants accessible to a broader population.

Urban vs. Rural Differences: Geographic and urbanicity factors also influence implant adoption. Urban and suburban areas tend to have more dental specialists (periodontists, oral surgeons, prosthodontists) offering implant services, and residents may have higher incomes, leading to higher uptake.
In contrast, rural areas and economically depressed regions show lower rates of implant utilization, even when tooth loss is more prevalent.
For instance, an oral health analysis in the greater Chicago region found that Gary, Indiana, a city with high poverty, had one of the worst tooth loss rates (nearly 38% of seniors in some neighborhoods have lost all their teeth).
However, relatively few of those individuals had access to implants as a solution, due to cost barriers and shortage of local implant providers.
Rural counties in the Midwest and South face similar challenges: residents often must travel far to find an implant dentist, and many settle for dentures because advanced surgical options are limited.
National market research notes that North America’s implant penetration lags behind Western Europe, partly because rural and low-income groups in the U.S. have not been reached effectively.
Still, as implant training becomes more common for general dentists (nearly one-third of U.S. general dentists now surgically place implants in their practice), availability is slowly expanding beyond big cities.
The trend of corporate dental chains and traveling specialists offering implant clinics has begun to bring implants to more middle-class and rural patients.
Nonetheless, a pronounced urban-suburban versus rural divide remains, with implant adoption highest in well-resourced communities and lowest in areas with dentist shortages.
Public health planners are aware that improving oral health equity may require subsidizing care or building programs to serve high-need rural populations with solutions like implants, not just extractions.
Contact our dental team to understand your tooth replacement options and create a personalized plan that supports long-term oral health.
Indiana’s Dental Implant Adoption: State and Local Insights
Indiana largely mirrors the national trends in tooth loss and implant adoption, though with some unique local characteristics.
Broadly, Indiana has slightly worse overall oral health indicators than the U.S. average, for example, nearly 19% of Indiana adults aged 65+ have lost all their natural teeth, compared to about 17% nationally.
This high rate of edentulism (complete tooth loss) points to a substantial potential need for restorative options like implants among Indiana seniors.
Over 100,000 Hoosier residents are completely edentulous and millions more have partial tooth loss. Yet, as in other states, only a small fraction have received implants to replace those missing teeth.
There is no comprehensive statewide survey of implant prevalence, but we can infer from national data and regional reports that Indiana’s implant uptake is growing in line with national growth, albeit with disparities across communities.
Statewide Adoption Levels: Based on population, Indiana (with ~6.8 million people, about 2% of the U.S. population) would be expected to account for roughly 8,000–12,000 new dental implant placements per year in the mid-2020s. This estimate comes from projecting national procedure volumes to the state level.
For instance, Minnesota (1.7% of the U.S. population) was estimated to have about 8,000–9,000 implant procedures in 2026; Indiana, being slightly larger, likely sees on the order of ten thousand implants annually by 2025. While the exact number can vary, it suggests that each year thousands of Hoosiers are opting for implants.
Anecdotally, implant dentistry has become a common offering in Indiana’s metropolitan areas, most oral surgery and periodontics practices in cities like Indianapolis, Fort Wayne, South Bend, and Evansville advertise implant services, and even general dentists in smaller towns increasingly restore or even place implants.
The American Dental Association’s market data show that many Indiana dental practices have incorporated implant treatment as the technology has become more accessible.
Overall, the state-level growth trend is positive: compared to five years ago, significantly more Indiana residents are receiving implants now, reflecting national momentum.
Regional and Demographic Disparities in Indiana: Within Indiana, implant adoption varies widely by region and socioeconomic factors. Urban and suburban counties with higher incomes and dentist availability have far greater uptake of implants than do rural and low-income areas.
For example, affluent suburban communities around Indianapolis (such as Hamilton County) or around Chicago (Lake and Porter Counties in NW Indiana) have more residents who can afford implants and more providers to deliver care.
In contrast, certain pockets of Indiana suffer from a combination of high tooth loss and low implant usage.
Northwest Indiana provides a telling case study: cities like Gary, Hammond, and East Chicago have historically high rates of tooth loss, one local survey noted that Gary had the highest senior toothlessness rate in the region, with over one-third of seniors completely toothless in some neighborhoods.
However, the demand for implants in these communities is held back by economic constraints. Implants cost several thousand dollars per tooth, and in areas where many residents lack dental insurance or disposable income, dentures remain the default solution for missing teeth.
Likewise, rural areas in Indiana with high poverty (e.g. parts of southern Indiana or some farming communities) show low implant adoption, residents either lack awareness of implants or cannot access a specialist nearby. A shortage of prosthodontists and oral surgeons in rural Indiana further limits local availability.
Many patients would have to travel to Indianapolis or another city for an implant, which is a barrier for older or low-income individuals.
On the other hand, more prosperous Indiana communities see much higher implant utilization. In suburban Indianapolis or college towns like Bloomington and West Lafayette, edentulism rates in seniors are much lower (often under 10%) and middle-class patients increasingly choose implants over dentures.
These areas also benefit from dental clinics that offer financing or accept a variety of payment plans, making implants more attainable.
The contrast can even be seen within the state: in one analysis, rural Lake County towns had senior edentulism around 23–25%, whereas wealthier parts of Porter County were closer to the national average or better (only ~10% fully toothless).
This suggests that Indiana’s implant adoption is strongly tied to local economics and access to care.
Role of Medicaid and Insurance: Indiana’s public dental coverage historically has been limited for adults. Until recently, Indiana Medicaid capped adult dental benefits at a low annual amount (around $600), which effectively excluded costly procedures like implants.
In 2023, policy changes in Indiana’s Medicaid program started to separate certain surgical dental services from that cap, but dental implants are still generally not covered for adults unless under extraordinary medical circumstances. Consequently, low-income Hoosiers on Medicaid rarely receive implants.
Seniors on Medicare face a similar issue, as traditional Medicare does not cover dental implants, and only some Medicare Advantage plans offer limited dental implant benefits. These insurance gaps contribute to the urban-rural and income-based disparities observed in implant uptake across Indiana.
Public health officials note that improving adult dental benefits (through Medicaid expansion or other programs) could increase the use of implants for those who currently cannot afford them, such as providing implants to stabilize dentures for the elderly.
As of now, however, implants in Indiana are predominantly obtained by those who can pay out-of-pocket or via private dental insurance reimbursement.
Demographics in Indiana: The demographic profile of Hoosiers receiving implants likely parallels the national profile: mostly middle-aged and older adults, skewing toward higher education and income levels.
Indiana’s population is aging, about 16% of residents are 65 or older, a share that is growing each year. This aging trend will raise the pool of people with missing teeth, and thus potential implant candidates, in the state.
We can expect the median age of implant patients in Indiana to be in the 50s or 60s, as tooth loss sufficient for implants (such as losing molars or needing full-arch replacements) tends to occur later in life.
By income, the typical implant patient in Indiana comes from the upper middle class (since the procedure can cost $3,000-$5,000 per tooth).
Individuals from lower socioeconomic brackets, including many racial/ethnic minorities in Indiana, remain underrepresented among those getting implants, reflecting a broader healthcare access issue.
One positive sign is that dental professionals in Indiana are making implants more approachable: more general dentists are training in implant placement, and some clinics offer sliding scale fees or in-house discount plans to help patients without insurance.
These efforts could gradually broaden the demographic reach of implants in the state.
County-Level Highlights: While hard data at the county level are sparse, a few illustrative points can be made. Marion County (Indianapolis) likely leads the state in absolute number of implants placed annually, given its population and concentration of dental specialists.
The donut counties around Indianapolis (Hamilton, Boone, Hendricks, etc.) are also hotspots for implant dentistry, supported by higher household incomes.
In Northern Indiana, the suburban counties near Chicago (Lake, Porter) see significant implant activity in their more affluent enclaves, but also contain underserved communities with low implant rates (as noted with Gary).
Many smaller counties in Indiana may have only one or two dentists placing implants, if any, which can limit local adoption. For example, a rural county might rely on visiting specialists or refer patients to bigger cities for implant surgery.
Public health data mapping has shown that some Indiana counties with the fewest dental providers per capita correspond to those with the highest rates of tooth extractions, implying that in such areas, tooth loss is addressed by removal rather than replacement.
Until the distribution of dental implant services becomes more even, county-level disparities will persist.
Save time and avoid extra appointments. Contact All In The Family Dental to get expert dental services in comfort.
Conclusion and Implications
Dental implant adoption in the U.S. has entered a high-growth phase, with usage expanding annually and moving into the mainstream of dental care. Tens of millions of Americans stand to benefit from implants, and recent years have seen record numbers of procedures as technology, training, and awareness improve.
National trends show a clear trajectory: more patients are choosing implants over traditional dentures or bridges, leading to steady market growth and innovation in the field.
At the same time, these benefits are not reaching everyone equally, socioeconomic and geographic disparities are pronounced, both nationally and within states like Indiana.
Indiana’s experience reflects the challenges of making advanced dental care accessible in a state with diverse communities: urban centers are keeping pace with modern implant dentistry, whereas rural and underserved areas lag behind due to cost and access issues.
For dental professionals and public health planners, these trends highlight a need for targeted strategies.
Efforts such as community dental clinics, mobile dental units, or subsidy programs could help bring implants and other restorative treatments to populations that currently have unmet needs (for example, low-income seniors who might otherwise live with ill-fitting dentures).
Education campaigns can also increase awareness that implants are a viable, long-lasting solution for tooth loss, potentially encouraging more people to seek consultations, even in Indiana’s smaller towns.
As the population ages and tooth retention improves only modestly among certain groups, the demand for implants is expected to keep rising.
Planning for this future means training more dentists in implantology, considering insurance reforms to cover medically necessary implants, and continuing to monitor adoption trends through surveys and research.
In summary, dental implants in the U.S. and Indiana are on an upward trend, offering improved quality of life for many edentulous or partially edentulous patients. The coming years will hopefully see this innovation become accessible to all segments of the population, closing gaps in oral health outcomes.
By understanding these trends and the factors behind them, stakeholders can better prepare for and shape the next decade of implant dentistry.
References:
- Elani, H.W. et al. (2018). Trends in Dental Implant Use in the U.S., 1999–2016, and Projections to 2026. Journal of Dental Research, 97(13), 1424-1430. (Analysis of NHANES data showing implant prevalence rising from 0.7% to 5.7% by 2016 and projected up to ~17–23% by 2026).
- Thakkar, R. (2022). Trends in Dental Implants 2022. American Academy of Implant Dentistry – LifeSmiles Blog. (Highlights that over 3 million implants were placed in the U.S. in 2019, about 1 million patients treated per year with ~2.5 million implants, and discusses drivers like aging population and technology).
- Imagine Your Smile Dental Blog (Dr. Mark W. Wilhelm) (2026). 2026 U.S. & Minnesota Implant & Cosmetic Dentistry Demand Report. Woodbury, MN. (Provides projections that 23% of adults with missing teeth could have implants by 2026 nationally, and uses population modeling to estimate state-level procedure volumes such as 8,000–9,000 annually in Minnesota (1.7% of U.S. population)).
- Northwest Oral Surgeons (2025). Tooth Loss, Extractions, and Dental Implant Demand: U.S. and Northwest Indiana Trends (2015–2026). NorthwestOralSurgeons.com Blog. (Describes high tooth loss in NW Indiana: e.g., ~38% of seniors in Gary with no teeth; notes economic barriers to implants in these communities and contrasts with higher-income areas where edentulism is ~10%).
- iData Research (2025). U.S. Dental Implant and Final Abutment Market Analysis, 2025–2031. (Market report indicating the U.S. implant market was ~$2.1B in 2024 and forecast to reach $3.1B by 2031 at ~5.9% CAGR, reflecting steady growth in implant procedures and related products).
- American College of Prosthodontists – ACP. Facts & Figures: Tooth Loss (c.2017). GoToAPro.org. (Reports that 120 million Americans are missing at least one tooth and 36 million are edentulous; other sources cite epidemiological estimates of up to 178 million with at least one missing tooth).
- Stofer, W. (2019). Tooth Loss and Dental Implant Statistics. Dental Solutions of Warsaw, IN Blog. (References AAID data: ~3 million Americans have implants, which was ~1.6% of those with missing teeth at the time; also notes implant success ~98% as per Journal of Oral Implantology).
- Dr. John Patterson, DMD (2024). Dental Implant Statistics 2025 (web article). (Aggregates various data: approximately 3 million implants placed per year in the U.S. as of mid-2020s; ~178 million Americans with missing teeth; about one-third of general dentists place implants; etc., illustrating the mainstreaming of implant dentistry).
- Healthline (2024). Everything You Need to Know About Mini Dental Implants. (Cites ACP estimate that around 178 million Americans are missing at least one tooth, underscoring the potential candidate pool for implants).
- America’s Health Rankings – United Health Foundation (2023). Senior Report: Indiana State Summary. (Lists Indiana’s rate of complete tooth loss among adults 65+ at 18.8%, slightly above the national average, indicating a significant burden of edentulism in Indiana’s senior population).